Auto insurance is viewed as a necessity by many individuals, and almost all states require drivers to maintain minimum coverage. Therefore, the affordability of auto insurance continues to be an important public policy issue. This Brief updates previous Insurance Research Council (IRC) work on auto insurance affordability, showing trends in auto insurance affordability through the most recent data in 2022 and including projections for 2023 and 2024.
This Brief also shows the wide range of affordability across states. These differences in affordability are ultimately driven by underlying costs, and examining the cost drivers in different states can uncover opportunities for improving affordability for all consumers.
The IRC calculates an index to measure the affordability of auto insurance. The affordability index is the ratio of average auto insurance expenditures to median household income. It measures the proportion of household income going to pay for auto insurance, where a higher index indicates less affordable insurance. Data for median household income are from the U.S. Census Bureau. Average auto insurance expenditures data are published by the National Association of Insurance Commissioners (NAIC). While some studies of affordability estimate insurance costs by gathering rating quotes for minimum coverage, the NAIC measure provides an estimate of what consumers spend per insured vehicle. As such, the data reflects differences among states in terms of coverage requirements, policy selections, tort laws, and other factors.
The goal of calculating an affordability index is not to establish a particular threshold level at which auto insurance becomes affordable or unaffordable. Such a threshold would be subjective, as different parties can reasonably disagree about what would constitute affordable insurance. Rather, the index is a tool to measure and compare auto insurance affordability over time and across jurisdictions.
This analysis looks at the affordability of auto insurance for the overall population and does not address the issue of affordability among underserved populations. Affordability trends among minority and lower income consumers is an important topic but requires the examination of more granular data than the countrywide and statewide data presented in this analysis. Moreover, it is important to note that affordability for traditionally underserved consumers is ultimately determined by underlying costs, just as it is for the overall population.
Trends in Auto Insurance Losses, Premiums, Expenditures
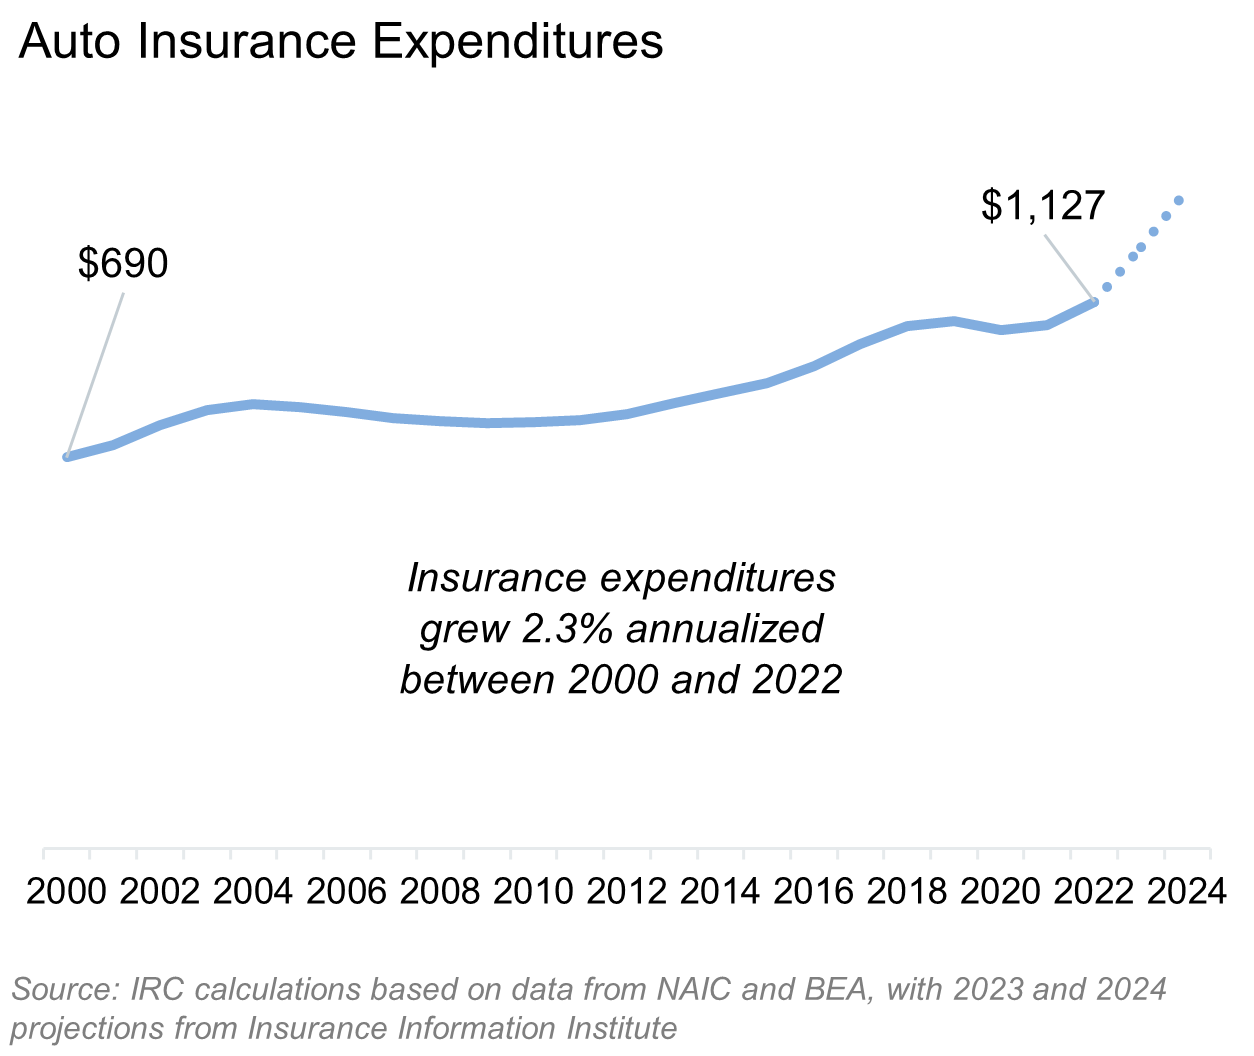
In 2022, the most recent year for which data are available, the average auto expenditure per vehicle was $1,127, a 6.1 percent increase from 2021. Between 2000 and 2022, insurance expenditures grew 2.3 percent annualized.
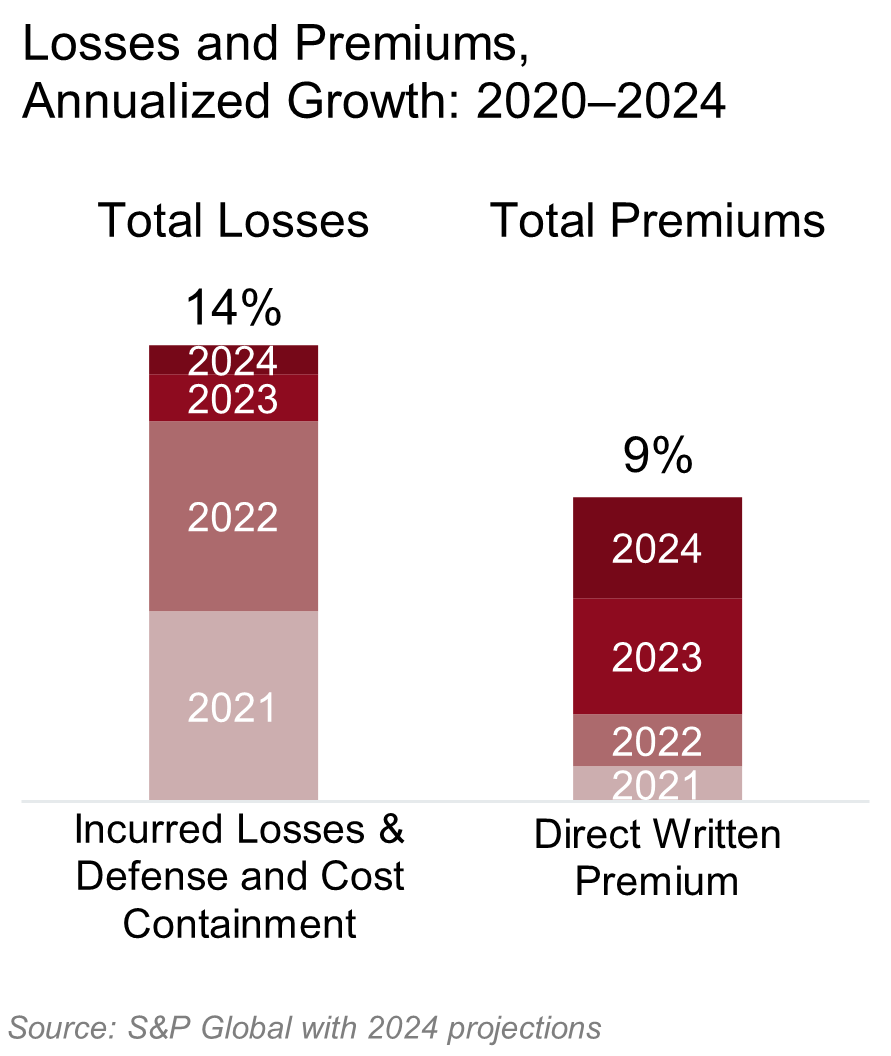
To reflect the more recent escalation in insurance claim costs and resulting premium increases, this Brief incorporates projections for 2023 and 2024. The auto insurance landscape has changed dramatically in the years since the onset of the COVID-19 pandemic. Insurance losses soared in 2021 and 2022 as miles travelled began to recover, boosted by high rates of overall economic inflation, rising severity in injury claims from deteriorating driving behavior and legal system abuse, and escalating vehicle repair and replacement costs from supply chain disruptions. As a result, personal auto losses increased 14 percent annualized between 2020 and 2024. In comparison, personal auto premiums rose 9 percent annualized.
With Losses Soaring Since 2020, Expenditures on the Rise