Louisiana remains the least affordable state in the nation for both personal auto and homeowners insurance due to a combination of high insurance expenditures and relatively low median income. The state’s vulnerability to hurricanes undoubtedly contributes to the high cost of homeowners insurance. However, Louisiana’s claim frequency and litigation rates far exceed other hurricane-prone states — except for Florida, which has recently taken significant legislative action to address its own insurance crisis.
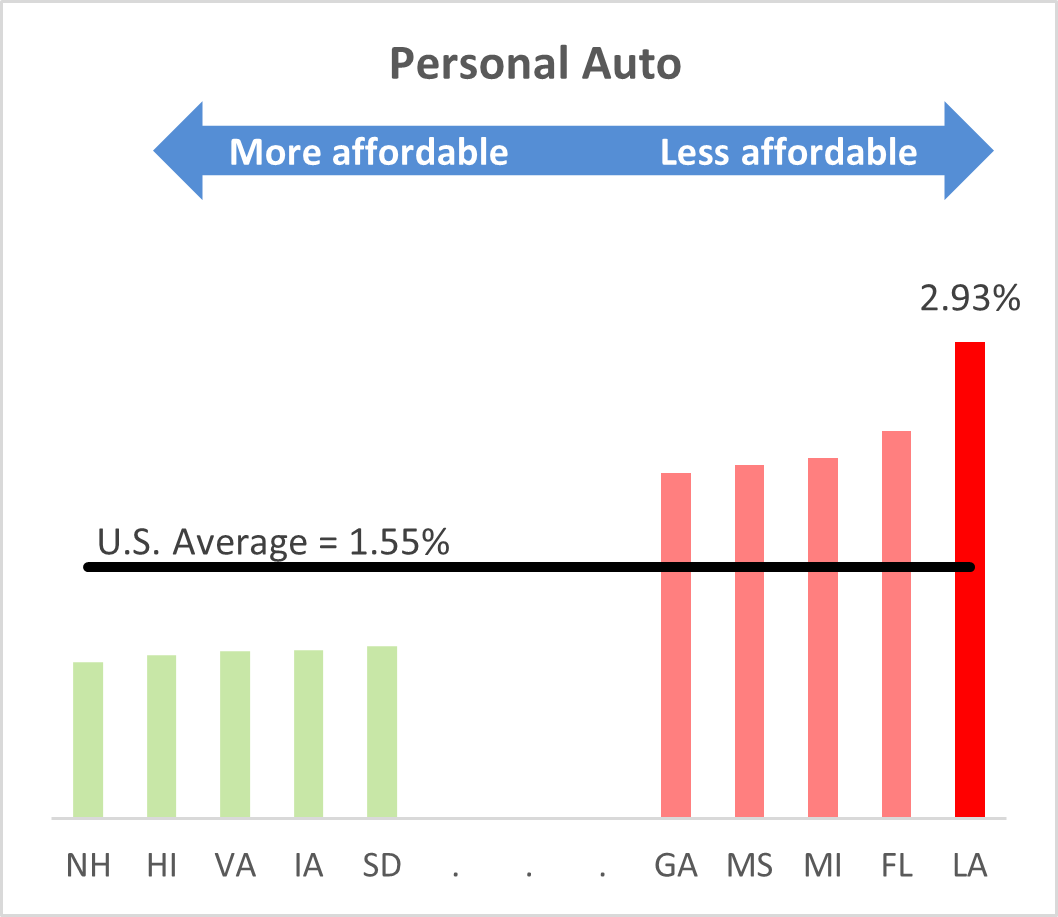
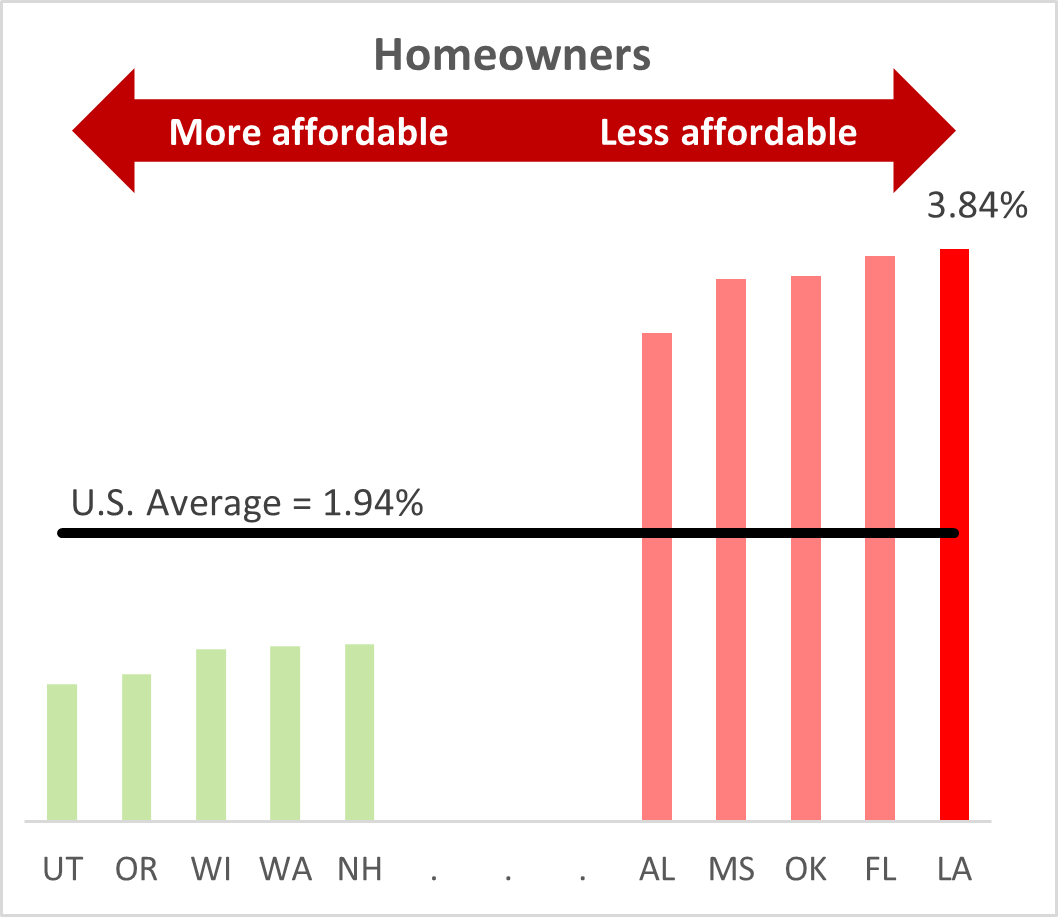
In 2020, the average annual expenditure for auto insurance in Louisiana was $1,495, which is more than 40 percent above the national average. Auto insurance costs accounted for 2.93 percent of the median household income in the state. Homeowners in Louisiana also pay significantly more for insurance compared to the national average. With an average annual expenditure of $1,965, homeowners costs are among the highest in the country and represent 3.84 percent of the median household income in the state. This is 55 percent higher than the national average.
Louisiana is the least affordable state in the nation for both auto and homeowners insurance, resulting from a combination of natural disasters, economic conditions, and the state’s litigation environment.
Affordability issues in Louisiana’s personal insurance sector stem from multiple factors. The state has faced multiple major weather events, with extensive litigation following each natural disaster. Rising auto-repair and construction costs, as well as the state’s relatively low household income, have compounded these issues. In addition, the litigation environment in Louisiana further contributes to the complexities of the insurance landscape. According to a report by the American Tort Reform Association (ATRA), Louisiana has experienced elevated attorney advertising rates, particularly in legal services television advertising. The fourth quarter of 2020 alone witnessed a staggering $12.4 million spent on advertisements for legal services and soliciting legal claims. This accounted for 5.6% of all local legal services TV ads aired in the country during that period.
This insurance environment has led to the insolvency of several insurers and the departure of key insurance providers from the market. The remaining insurers have opted to limit coverage and raise premiums. State efforts to tackle coverage gaps have included incentive programs for private insurers and greater reliance on the state-run insurer Louisiana Citizens Property Insurance Corporation. This last-resort insurance can be quite expensive, making it unaffordable for many — especially the state’s most vulnerable residents. These hardships have contributed to a declining population in Louisiana, as individuals and businesses are uprooting and seeking better affordability elsewhere. According to a new United States Census Bureau estimate, Louisiana's population declined by almost 1 percent in 2022, a loss of nearly 39,000 people.
Compared to the rest of the country, Louisiana is the least affordable state for both personal auto and homeowners insurance, as determined by the ratio of average personal insurance expenditures to median household income. Data on median household income are from the U.S. Census Bureau. Average homeowners and personal auto insurance expenditures data are from the National Association of Insurance Commissioners (NAIC).
Homeowners insurance expenditures as a percentage of median income in Louisiana (3.84 percent) were nearly two times higher when compared to the U.S. average of 1.94 percent. Only three other states — Florida, Mississippi, and Oklahoma — exceeded 3.00 percent. This disparity was similar for personal auto: Louisiana topped the country ranks with insurance expenditures equal to 2.93 percent of income, compared with the countrywide average of 1.55 percent.
This analysis looks at the affordability of homeowners insurance for the overall population and does not address the issue of affordability for specific demographic or geographic risk profiles. It is also worth noting that the data to estimate affordability are available only through 2020, so this analysis does not reflect more recent increases in personal insurance rates.
Ultimately, personal insurance affordability is determined by the underlying key cost drivers, which must be addressed to improve affordability. Insurance Research Council compiled several factors that contribute to the rising cost drivers not only in Louisiana, but also across the country. These factors are examined in the next sections of this research brief.
Personal Auto Insurance Cost Drivers
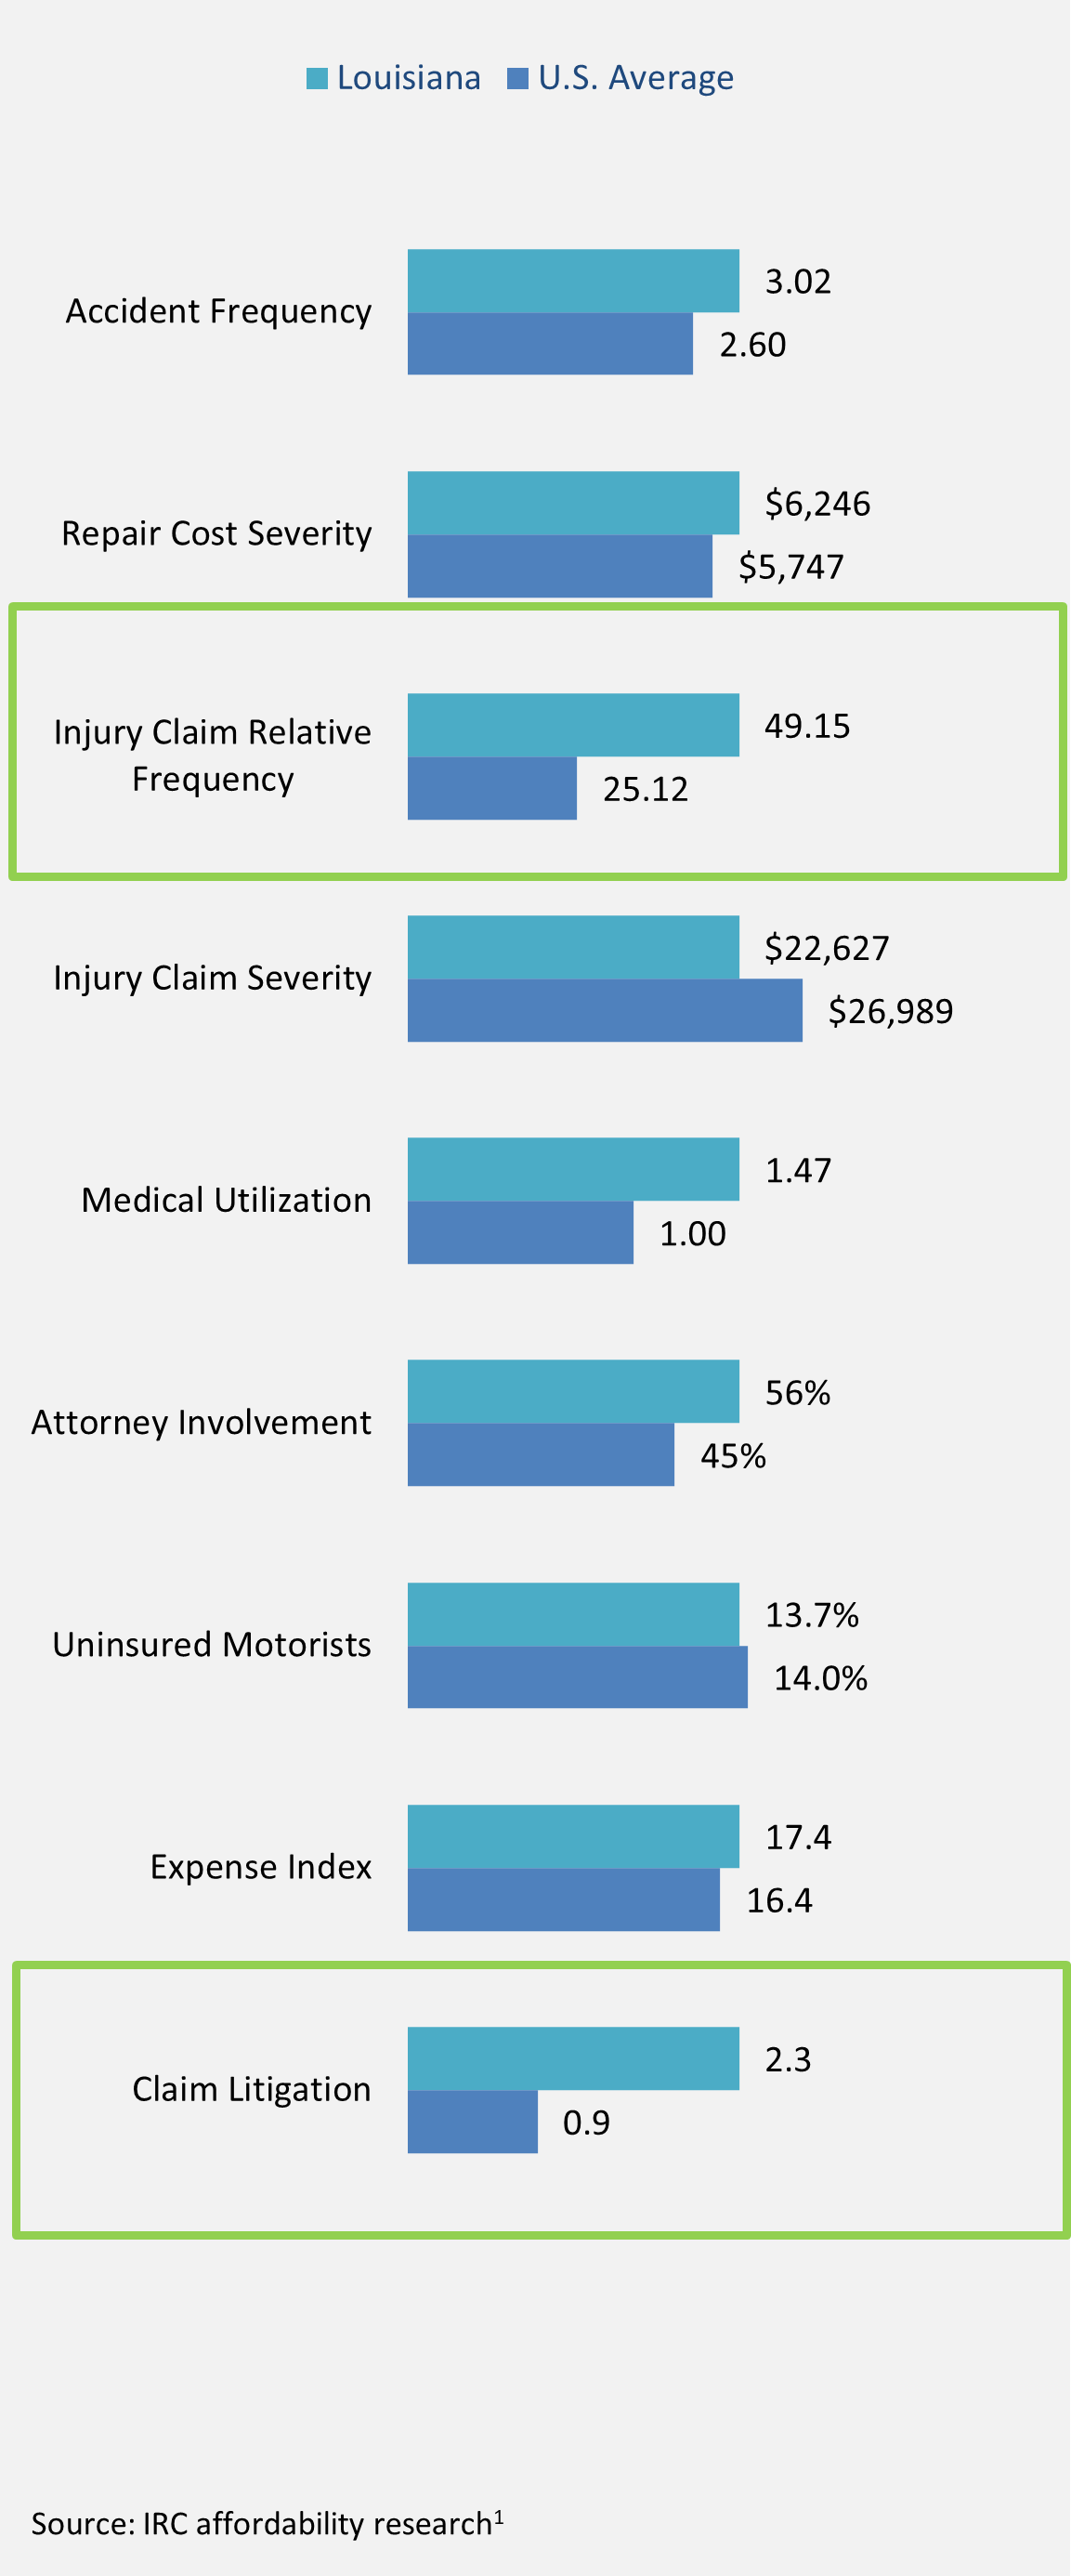
Efforts to improve auto insurance affordability must begin with the underlying cost drivers. In nearly every key cost driver, Louisiana costs are well above the national average, particularly in Injury claim relative frequency and the claims litigation drivers.1
Accident frequency: The number of property damage liability claims per 100 insured vehicles in Louisiana is 16 percent higher than the countrywide average.
Repair cost severity: Repair costs in Louisiana are slightly higher than in the rest of the country.
Injury claim relative frequency: Louisianians show a greater propensity to file injury claims once an accident has occurred, with a relative claim frequency almost twice the national average.
Injury claim severity: The average amount paid per claim for auto injury insurance claims for all injury coverages combined in Louisiana is lower than the national average, largely due to lower policy limits.
Medical utilization: Louisiana auto claimants are more likely than those in other states to receive diagnostic procedures, such as magnetic resonance imaging (MRI).
Attorney involvement: Louisiana claimants are more likely than those in other states to hire attorneys. Attorney involvement has been associated with higher claim costs and longer settlement times.
Uninsured motorists: Despite the high cost of insurance, the uninsured rate in Louisiana is slightly below the national average. However, evidence suggests that underinsured motorists are a significant problem in the state.
Expense index: Claim settlement is somewhat more expensive in Louisiana, as measured by the amount insurers spent to process, investigate, and litigate claims (loss adjustment expenses) as a percentage of incurred losses.
Claim litigation: The rate of litigation in personal auto claims in Louisiana is more than twice the national average. This rate is the second highest in the country, surpassed only by Florida.
Homeowners Insurance Cost Drivers
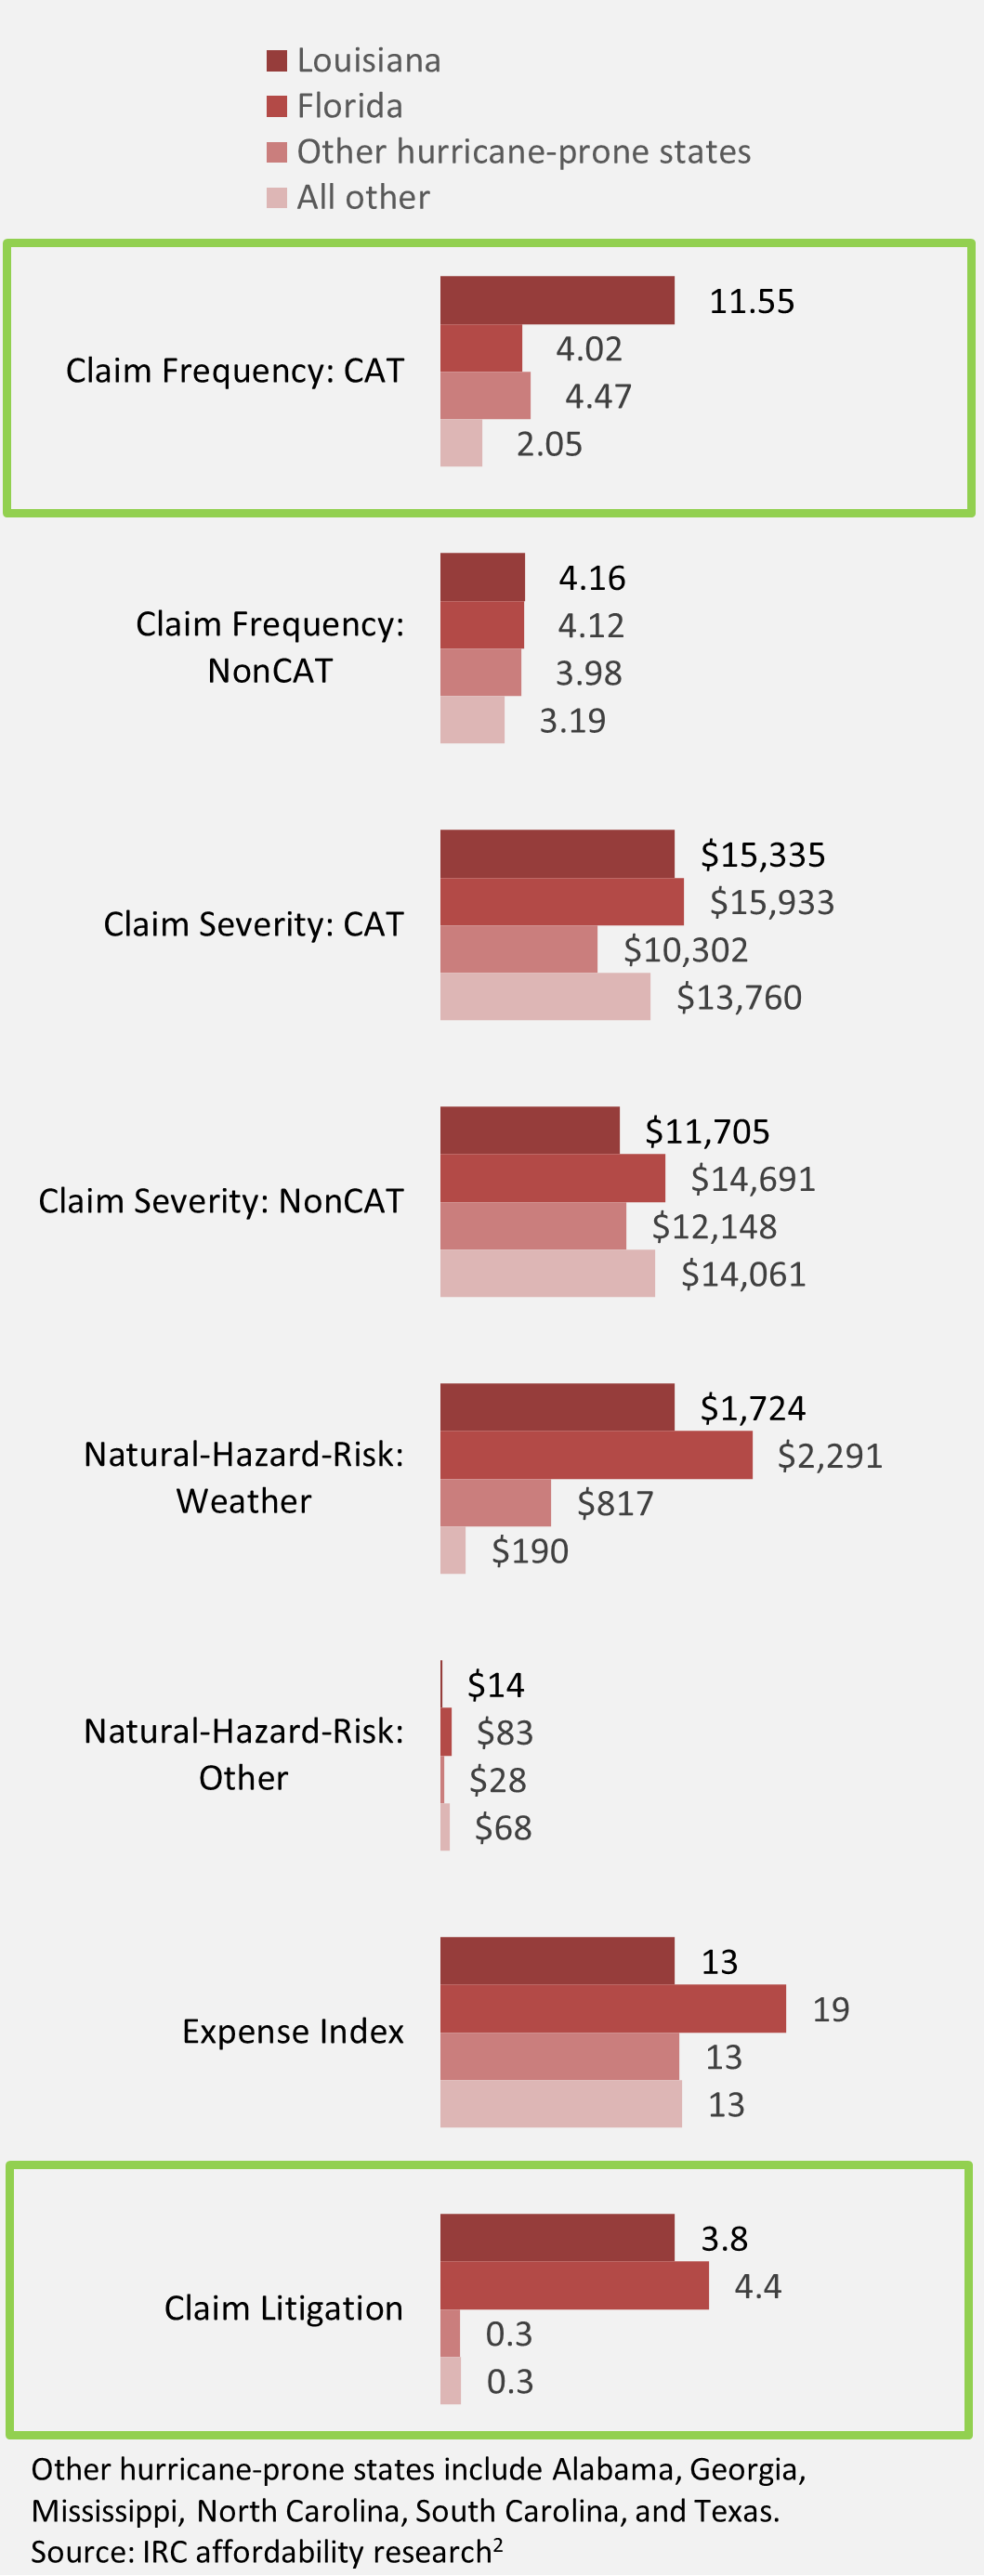
Similar to auto insurance affordability, nearly every homeowners insurance cost driver in Louisiana is well above the national average. Particularly dramatic difference from the countrywide average is observed in the claim frequency (CAT) and claims litigation drivers.2
Claim frequency, catastrophe claims (CAT): The number of catastrophe claims paid for every 100 exposures insured for the entire year in Louisiana is almost 6 times higher than the countrywide average.
Claim frequency, non-catastrophe claims (NonCAT): The number of non-catastrophe claims paid for every 100 exposures insured is somewhat higher in Louisiana.
Claim severity, catastrophe claims (CAT): In the hurricane-prone region, Louisianians are second only to Floridians in the amount paid for the average homeowners insurance claim. Louisiana is 12 percent higher than the countrywide average.
Claim severity, non-catastrophe claims (NonCAT): The average claim payment for all non-catastrophe claims paid in Louisiana is lower than the national average.
Natural-hazard risk, weather: Louisiana’s exposure to building damage from weather hazards is second only to Florida’s and is dramatically higher than other states’.
Other natural-hazard risk: Louisiana is less vulnerable to building damage from other natural hazards such as wildfires.
Expense index: The amount insurers spent to process, investigate, and litigate claims (loss adjustment expenses) as a percentage of incurred losses is on par with the rest of the country.
Claim litigation: Claims in Louisiana were more than 12 times more likely to involve litigation, compared with states other than Florida.
Notes
- For more information about how these cost drivers are defined, see IRC’s 2022 report State Variations in Auto Insurance Affordability or 2021 research brief Auto insurance Affordability: Countrywide Trends and State Comparisons.
- Accident frequency is 2022 data from the IRC study Trends in Personal Auto Insurance Claims: 2002–2022.
- Repair costs reflects property damage liability claim severity in 2022 data from the IRC study Trends in Personal Auto Insurance Claims: 2002–2022.
- Injury claim relative frequency is the number of bodily injury claims for every property damage liability claim in 2022, based on data from the IRC study Trends in Personal Auto Insurance Claims: 2002–2022.
- Injury claim severity is the mean payment for bodily injury claims in 2022, based on data from the IRC study Trends in Personal Auto Insurance Claims: 2002–2022.
- Medical utilization is based on 2017 data from IRC’s closed-claim study. For more information about IRC’s closed-claim research, see Countrywide Patterns in Auto Injury Insurance Claims.
- Attorney involvement reflects the percentage of closed auto injury claims with attorneys, from IRC’s closed-claim study.
- Uninsured motorists rate is the ratio of uninsured motorists claim frequency to bodily injury claim frequency in 2022, from IRC’s report Uninsured Motorists, 2017–2022.
- Expense index reflects loss adjustment expenses as a percentage of incurred losses, 2017–2021 average, based on data from NAIC’s Report on Profitability by Line by State in 2021.
- Claim litigation reflects the percentage of personal auto claims with litigation, based on data from NAIC's Market Conduct Annual Statement Scorecard and measured by the ratio of suits opened to claims closed without payment multiplied by the ratio of claims closed without payment to the total claims closed.
- For more information about how these cost drivers are defined, see IRC’s 2023 report Homeowners Insurance Affordability: Countrywide Trends and State Comparisons.
- Claim frequency data are 2017–2021 averages from the IRC study Trends in Homeowners Insurance Claims: 2001–2021. Claims are designated as catastrophe or non-catastrophe claims based on the total dollar amounts of expected losses and the number of policyholders affected.
- Claim severity data are 2017–2021 averages from the IRC study Trends in Homeowners Insurance Claims: 2001–2021.
- Weather and other natural-hazard risk data are the expected annual loss to buildings per $1 million of aggregate building value, based on National Risk Index data from the Federal Emergency Management Agency. Weather hazards include cold wave, hail, heat wave, hurricane, ice storm, lightning, strong wind, tornado, and winter weather. Nonweather hazards are avalanche, landslide, tsunami, volcanic activity, and wildfire, among others. Losses due to coastal or river flooding and earthquake are excluded because they are not covered by standard homeowners policies.
- Expense index indicates loss adjustment expenses as a percentage of incurred losses, 2017–2021 average, based on data from NAIC’s Report on Profitability by Line by State in 2021.
- Claim litigation reflects the percentage of homeowners claims with litigation, based on data from the NAIC’s Market Conduct Annual Statement Scorecard and measured by the ratio of suits opened to claims closed without payment multiplied by the ratio of claims closed without payment to the total claims closed.