This report provides countrywide and state estimates for the prevalence of uninsured and underinsured driving, as well as an examination of several factors that are associated with variations in uninsured motorists (UM) and underinsured motorists (UIM) rates across states, including economic factors, insurance costs, and state insurance laws and regulations.
Countrywide, one out of every three drivers was either uninsured or underinsured in 2023.
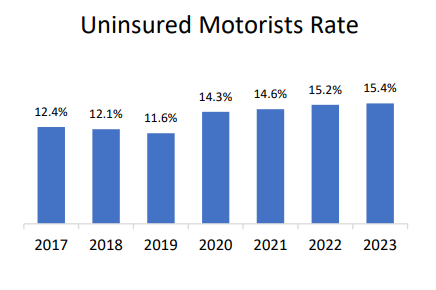
Uninsured motorists are drivers who, despite near-universal legal requirements, operate motor vehicles without having liability insurance coverage to compensate others for injuries or physical damage resulting from auto accidents in which they were at fault.
- In 2023, more than one in seven drivers countrywide (15.4 percent) were uninsured.
- The UM rate jumped in 2020 with the onset of the pandemic and rose steadily in each of the following three years.
- The prevalence of uninsured motorists varied substantially among individual states, ranging from a low of 5.7 percent in Maine to a high of 28.2 percent in Mississippi.
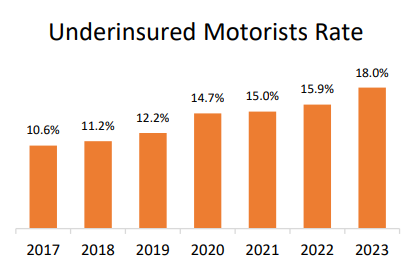
Underinsured motorists are drivers who have purchased auto liability insurance but cause an accident that results in injury costs that exceed their chosen liability policy limits. UIM rates are determined by both the chosen liability policy limits and the accident victim’s reported losses from their injuries. Thus, UIM rates are influenced by upward pressure on average claim severity.
- In 2023, more than one in six drivers countrywide (18.0 percent) were underinsured.
- Similar to the UM trend, the UIM rate showed a sharp increase in 2020 and continued to increase dramatically, spurred by increasing BI claim severity.
- The rate of underinsured driving ranged from a low of 4.6 percent in the District of Columbia to a high of 49.7 percent in Colorado.
IRC members can download this report for free as part of their membership. Non-members can purchase access.